« Purchasing Data Mart – cutting costs with analysis (Part 1) | Connecting the dimension table to the fact table- Vendor Example (Part 3) »
Creating a Fact Table with the Vendor dimension Purchasing DM (Part 2)
 In creating a data warehouse or data mart data model there are two key types of tables- fact tables and dimension tables. Fact tables hold the data to be analyzed, dimensional tables provide categories and analysis values that organize the data.
So we have our mission from Part 1: to analyze the “Acme does everything” company’s purchasing data and find ways to save money. The first step, however is getting a handle on the data. The IT department has given us the files, and with a smug smile told us to “have fun”. We’ve been given three files that are a snapshot of the purchasing data:
- Item_Master.txt – this holds all the items that Acme buys
- Vendor_Master.txt – this holds a list of all the vendors, with information such as their address
- PO_Detail.txt – this is the huge data set, all the purchase order data for the last four years
The Item and Vendor files aren’t very big, but the PO_Detail is over 340 Mb, and it holds almost four million purchase order lines. Don’t try to import it into Excel. Of course you need Excel 2007 to even try to import 4 million rows. In Excel 2003 it would take over sixty sheets and probably some VBA code to try it. I tried the import in Excel 2007- it takes 20 seconds just to tell me I’ll have to go back to the text file import multiple times to do multiple imports onto separate sheets. It took almost two minutes to do the first million rows. Even once we have the data spread across four sheets it’s not clear how to summarize millions of rows in excel easily.
Instead, let’s use the Datamartist tool to manage this data set and generate one thats more useful.
The first analysis we will do will be on the Vendor dimension, to determine who Acme’s big vendors are, and if we can negotiate some price reductions where we have leverage.
In Datamartist, very large files are not an issue because the tool can load in only preview data- this means that it’s possible to look at a sampling of a few hundred thousand rows, and design the transformation before running it on the whole data set.
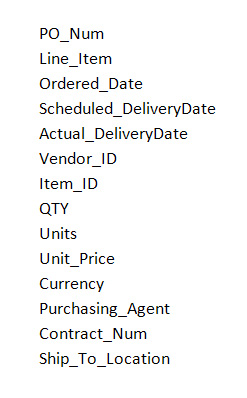
The PO Detail file has the columns shown- let’s answer the question – “Who are our biggest suppliers”?
So which columns do we need? We probably want to have some sense of trends over time so we’ll keep the order date, but summarize to Month, we’ll keep the Vendor ID of course, and then we need to use the Quantity and Price fields to calculate the total amount spent. Then we want to write this summarized data into Excel to check it out.
To do this in Datamartist all it takes is four simple blocks; A Text import block to load in the PO_Detail.txt file, a calculate block to multiply QTY by PRICE, a Summarize block to do all the summarizing, and an Excel export block to generate the excel file;

Each block passes its result to the next block via the connectors, and the last block saves it to an excel file we’ve specified.
Defining the calculation uses standard spreadsheet functions- here’s what the config area looks like;

And defining the summary is as simple as it looks- pick the columns you want, and select what kind of summary you want done.

We run it on a preview set of 100 thousand rows (takes about twelve seconds to run), and check the output.
It looks good, so we run on the whole 4 million rows;

About seven minutes later we have our result- an excel sheet with a manageable 130 thousand rows, total spend, by vendor, by month for four years;

Next up we need to create our vendor dimension, and join it to this mini fact table we have created. Stay tuned.
This is part of a 5 part series- here are the links to the various parts: 1,2 , 3 , 4 and 5
« Purchasing Data Mart – cutting costs with analysis (Part 1) | Connecting the dimension table to the fact table- Vendor Example (Part 3) »


The visual paradigm is very powerful … kudos