« Connecting the dimension table to the fact table- Vendor Example (Part 3) | Joining the Dimension Table to the Fact Table- Purchasing Data mart (Part 5) »
Hierarchies and Tree Structures in Dimensions- an Example Item Dimension (Part 4)
Having a way to create and manage tree structures (Hierarchies) with your dimension and fact tables is a key part of making a dimensional model in any data warehouse or data mart. Hierarchical structures lend themselves to managing a very large number of categories and we use them to create drill down paths.
Check out the first three parts of this series (1,2 and 3) to see what we’ve done so far.
In this installment, we will make a another dimension, the Item dimension. This will illustrate how the Datamartist tool allows you to quickly and easily generate hierarchies, and even edit and manage them in a graphical user interface.
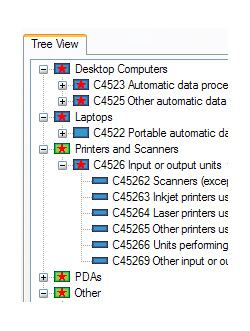
The head of purchasing for Acme has asked us to analyze the company’s spend on computer equipment- “I have a feeling some offices are spending more than others- but I don’t have the numbers to back it up. But I don’t want you to use the categories in the source system- I just want it broken down by Desktops, Laptops, Printers, PDAs and other. Can you do that with the data mart?”
In their source system, Acme is using the United Nations Central Product Classification, (UNCPC) and so we know that all the computer spending we’re interested is in division “C45 Office accounting and computing machinery”. The way the codes are structured is they have a code like “C45222”, so we want to take all codes with the left three characters being “C45”. We can do this easily with a filter block. After the filter block we connect a define reference block (to make a dimension), just as we did before-and finally, since we’re looking at hierarchies, we’ll add a recategorise block too- that last block in the chain is what we use to change the drill down structure;

Tree structures simplify alternate categorisation
The advantage of using a tree structure is we only have to rearrange the level of the hierarchy that encompasses the level of detail we need: we don’t have to map each individual product, just the higher levels. So it’s much less work to start, and when new products are added in the source system, they will automatically map up into the new categorization. Recategorising in excel often means search and replace at the bottom level which can cause errors, and has to be redone manually every time the data is updated.
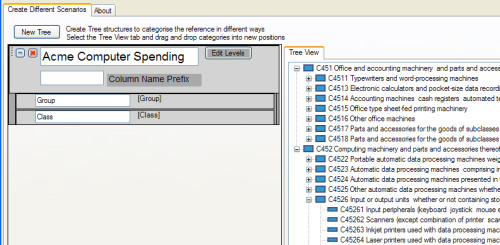
When we open the recategorise block, we simply pick the levels we want to see, and then are presented with a tree view that shows us the hierarchy, automatically generated from the underlying data.

Now, directly within the hierarchy we can edit categories, add new categories, and drag and drop categories around to build the new drill down that we want.  The interface is a lot like the windows file explorer, just like renaming and moving folders, except that you are building dimensional data. Of course, the underlying input data is not changed, so there is no need to modify the source system in any way, but the datamartist tool records all the mapping and is able to reproduce it when new data arrives.
You only have to edit the Hiearchy once, and from that point on your analysis can use both the existing, and the edited tree structure. It’s possible to create as many different hiearchies as required- it’s a fast way to do “what if” analysis, trying out different drill down paths and categorisations.
This is part of a 5 part series- here are the links to the various parts: 1,2 , 3 , 4 and 5
« Connecting the dimension table to the fact table- Vendor Example (Part 3) | Joining the Dimension Table to the Fact Table- Purchasing Data mart (Part 5) »


