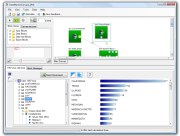
Datamartist is an easy to use, visual, desktop data profiling and ETL tool that provides a graphical environment to manage and transform data.
|
Use a visual, drag and drop environment to manage your data transformation. |
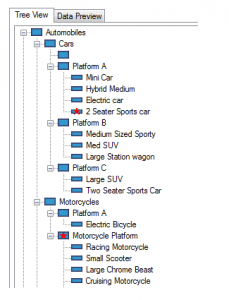
Create multiple drill down paths by defining hierarchies visually, creating new categories and editing names and labels. |
Manage very large data volumes. Process millions of rows and then summarize data to manageable analysis sets. |
|
Use the calculation engine to define new columns and conditions. |
Segment data the way you need it, using easy to define rules that create useful, meaningful categories. |
Eliminate duplicate records by designating master records, and mapping duplicates away. |
 |
||
|
Import data from multiple data sources. SQL Server, ODBC, MS Access and delimited text files. |
Combine reference data with the raw data to create data marts. |
Export data at any and all points in the process to Excel for further analysis or transformation. |
Data flows from block to block, getting transformed or organised at each step. Users can export any intermediate data set, or combine them within the data canvas to create powerful data analysis models right on their desktop.
You can create new analysis with ease
- Define new categories and rules
- Generate multiple scenarios
- Drag and drop edit complex tree hiearchies
Then, when you’ve got the data where you want it, your spreadsheets will be cleaner, more powerful.
- Export directly to Excel
- Generate multiple sheets within a workbook based on any criteria
- Browse the Datamartist documentation.
- Compare Datamartist functionality to spreadsheets and databases.
- Datamartist at the Financial Technology Show.
Purchasing Data mart Example with Datamartist:
- Intro to purchasing data mart example
- Summarizing 4 million rows with datamartist
- Creating a vendor dimension and eliminating duplicate rows
- Creating a dimension with hierarchies and tree structures
- Joining the dimension tables to the fact table
Using Datamartist is simple and visual:
- Drag blocks onto the canvas from the block library
- Connect the blocks together
- Configure the Blocks
- Export the results for further Analysis
At every step you can see what you are doing to the data, and you can use any intermediate data set for further transformation- take it in a new direction by adding more blocks.


