This is part three of an ongoing series that’s taking a look at data migration projects. In this part we’re going to talk about how important it is to know where you are starting from, before you head off on a new application journey. Understanding and mapping your legacy systems is a key success factor for a data migration project, but can be a very difficult and time consuming battle. In this post, I’ll talk a bit about some approaches I’ve found useful in my experience.
 If you like, you can start with Part one which was a light hearted introduction to data migration projects in general, and part two, where we talked about the importance of data quality.
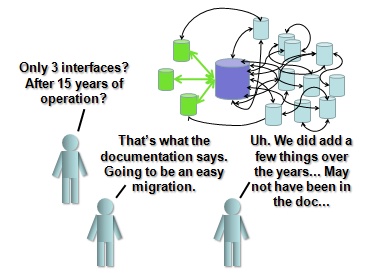
Why are we spending so much time on this? Thats the OLD system- we need to focus on the future!
Here are just some of the important things the legacy mapping needs to clarify:
- Data location– You can’t migrate data if if you don’t know what it is and where it is.
- Data dependencies to other systems All processes and interfaces that rely on interfaces to the legacy systems need to be either replaced or shut off. Often this means that even if the new system is not involved, other systems may stop working because they get data from the legacy systems. The data migration project is not just about turning on the new system. The consequences of turning off the old system have to be known and managed.
- Legal requirements to keep legacy data available. Even if data is not migrated to the new system there may be additional data migration requirements into data warehouses or documents that have nothing to do with the new application.
- Infrastructure dependencies. The actual infrastructure that the legacy systems are on might perform other tasks that although not directly related to the legacy system will cause issues when that infrastructure is removed. (For example, someone installed a service of some sort on one of the servers that is used by other applications that are completely unlrelated from a data point of view).
Often the first time the Legacy system is documented is just before it’s shut down.
Despite our best intentions, sometimes documentation doesn’t get updated. This is the reality for many systems, and particularly for legacy systems.
One of the first steps in a data migration project is to gather all the existing documentation for the legacy systems, and all the systems they talk to, and make sure its accessible to the data migration project team.
It is critical to have tight control over these documents, and to ensure that everyone works off a “live” version- because your mapping is going to update that documentation, and every developer, data modeler and application team member needs to know that they have the best and latest version.
The application interface diagram.
Now, the ideal situation is to have a dynamic, self correcting, scanning Configuration Management Database tool (CMDB tool) that already has every scrap of meta data about every application and all its interfaces ready to go.
If you have one of these, good for you, and you can stop reading.
For the rest of us, lets talk practical methods of mapping what we have.
How to get the data.
- Scan the environment- catch the interfaces in the act.
- Monitor network traffic to detect exchanges between applications.
- Scan file systems to find interface files and determine frequency.
- Catalog services and activity of those services on servers.
- Get out there and talk to people.
- Ask people- where is data from this system used?
- Look at management reports and trace backwards to find where information is pulled.
- Don’t assume the interface is direct. My record discovered is 6 hops from source to the excel sheet used by the CEO, with the information passing through two of the same systems twice.
- Hunt down people that were involved in the original installation. Often they’ll have key information that can save you time.
- Any other way that works.
What to do with it.
If you don’t have a complex tool to do the mapping of all your systems, then one approach that is a step above the “lots of excel sheets and powerpoint slides” approach, is to use a tool like Microsoft Viso. I’ve used it successfully to map applications, by having the drawing and the interfaces BE the database. This ensures that everything in the drawing is on the interface list, and everything on the interface list shows up on the drawing.
- Create different objects in Viso, and give them attributes. At a minimum you need an application, interface and database object.
- Draw the applications and the interfaces between them in a single large viso drawing, and fill in the attributes in the visio objects.
- Make some simple VBA code in the drawing to dump all the data into flat files or excel sheets (or directly to a DB if you get ambitious).
It’s simple, but it is far better than having spreadsheets, and a drawing- and then constantly trying to determine if the two agree with each other.
In the ERP project where I used this technique, we identified over 1500 interfaces between hundreds of application instances. The ERP project was a very large effort with hundreds of project resources, and multiple phased projects implementing a new common system. The actual original mapping took two people about 3 months to do. They had to work with about 30 different applications support people to systematically map all the applications, and the interfaces, one by one.
A key part of the job was to actually validate the documentation. IE if the documentation said there was a chron job that ran a script on server X, actually go to server X and watch it run. This meant that we could be confident in the map, and make plans based on it.
Everyone on the team used the drawing and lists generated from the drawing to stay on the same page. And it was a big page- the key is to also have access to a plotter- we were plotting out a pretty good size wall poster by the time we were done.
The ERP teams had the drawing taped up to the wall- and they were making notes right on it and emailing my team. We would update the master, and publish a new version, along with the generated lists.
In building this drawing, we found that most of the interfaces were “under” or “un”-documented, and that if documentation did exist, generally it was wrong. By establishing the “official” document for the legacy systems, we focused and coordinated the design effort in a way that would not have happened, if each team just had their own marked up copy of the original documentation or the part that was of interest to them.
Having the map means you can make the plan
This drawing and the interfaces mapped were critical in planning the migration.
- Create different layers in your drawing for each phase “Phase 1”, “Phase 2”, “Phase 3”, or “Feb 2010”, “Aug 2010”, “Jan 2011” etc.
- Hide or show systems and interfaces (including the new applications and interfaces) as they were phased in or out for each layer.
- By viewing and printing layers separately, you can see a step by step plan for the migration- with your application architecture and integration map at each phase.
This was a powerful tool to both do the planning, and to make sure everyone understood the timing and sequence. With multiple phases over a three year period, the project needed it, and without such an overall view, such critical planning would have been haphazard.
The challenge with this mapping is to find the right level of detail required. Not detailed enough and it is wasted effort. Too detailed and it will consume excessive resources and time.
A simple approach- What talks to what and what it runs on.
There are two key aspects to mapping your application architecture.
- Functional relationships- applications talking to other applications, with interfaces between them.
- Infrastructure relationships – which servers, network connections, services and databases are involved in the functional relationship
You can’t show both completely on a single drawing- don’t try. Some applications run on multiple servers, many servers run more than one application, data bases are shared by many, interfaces often use common infrastructure such as EAI tools etc.
The approach we took, and it worked well, was to show the functional relationships on the diagram, and hold the physical relationships (which databases were on which servers/clusters and which application ran on which server etc.) in the attributes of the applications.
We did sometimes show some physical attributes on the diagram for easy reading, but only as an annotation- the relationship was done via the attributes in the visio application objects.
This meant that you could ask “What runs on this server?” and could ask “Which servers are involved with this application?” by doing a filter or query on the data. Very useful things if you are planning to shut down a server. You make a checklist, and one by one make sure everything is either shutdown, or moved.
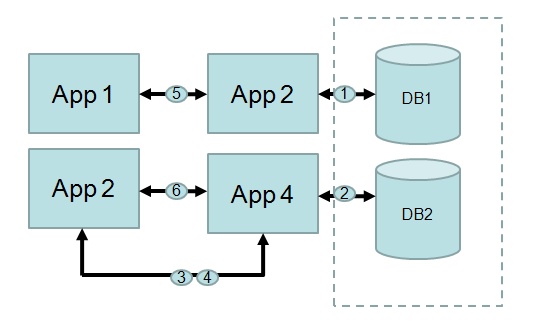
Here’s a simple example to illustrate what the diagram might look like;

The circles with the numbers were the interfaces, each one had attributes like “To” , “From” and “Method” etc. The level of detail you go to is a function of how ambitious you are, but at a minimum you need to record the fact that the interface exists.
So in summary:
- Create a single map of all your applications and interfaces and share it with everyone on the team
- Make sure you validate your map carefully, looking into the actual systems, and talking with as many people as needed to ensure you have captured everything
- Make a step by step plan for the migration, showing when each application, interface and infrastructure item is phased in or out.
Next up- the data dictionary and how do we get everyone to agree on those definitions?
Comments
5 responses to “Data migration Part 3- Mapping the legacy systems”
It’s hard to find educated people for this subject, but you sound like you know what you’re talking about!
Thanks
First of all I would like to say superb blog! I had
a quick question in which I’d like to ask if you do not mind. I was curious to find out how you center yourself and clear your head before writing. I have had difficulty clearing my thoughts in getting my ideas out there. I do enjoy writing however it just seems like the first 10 to 15 minutes are lost just trying to figure out how to begin. Any recommendations or hints? Cheers!
Hi would you mind letting me know which web host
you’re using? I’ve loaded your blog in 3 completely different internet browsers and I must say this blog loads a lot quicker
then most. Can you suggest a good internet hosting provider at a
reasonable price? Cheers, I appreciate it!
Hello,
I am writing a thesis at the moment on ERP systems, and your diagrams look very interesting. Have I got your permission to embed one of them in my thesis?
Thank you.
Aisha
Hello- sorry for the delay, missed your comment- please feel free to use an image, just please reference a link. Thanks!