« 6 Tips for making a business intelligence project budget | Datamartist V1.0.0 Released »
Workgroup BI the rise of the desktop data master
In this world of Web, the cloud and all things very enterprisy and platformy, it is becoming clear that more personal, often desktop based data analysis has an important role to play. After the huge consolidation that occurred around 2007, the word of the day was Platform Business Intelligence. Or at least thats what Oracle (who purchased Hyperion, Siebel, Peoplesoft and so many others), IBM (Cognos) and SAP (Business Objects) were telling us.
Well, it turns out that just by buying a lot of tools and putting the name “Oracle”, say, on them they don’t become an integrated platform.

Last year, Gartner predicted that 2009 would see the re-emergence of workgroup bi, (you can find an article published by TDWI here that discusses the report).
Don’t get me wrong- there are lots of reasons to use these BI platform type tools- and any enterprises architecture is probably going to have them to provide certain types of BI.
But the power of workgroup BI is undeniable.
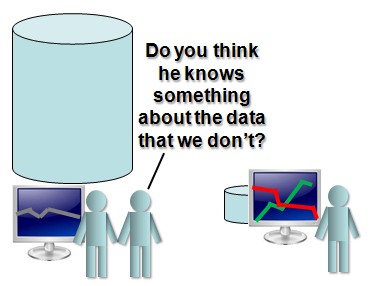
Workgroup BI takes advantage of a key secret weapon that can allow an enterprise to get at the information it needs to make great decisions. It’s fast, it’s adaptive, it can figure out which questions to ask and find the answers, and it follows the business needs closely. Workgroup BI’s secret ingredient is called a person.
People that are passionate about data have always done a huge amount of the analysis themselves. Because of this they can get close to the data- and people that understand the business and have the tools to get close to the data can provide real insights.
The trick has always been having the right tools. Excel has obviously been a work horse in this area, but a long list of other tools have been used by those who are not content to wait for the data warehouse to get finished, or for the new version of the dimension to get published.
In his blog datadoodle, Ted Cuzzillo talked about these analysts:
It’s an old group that’s getting new attention: creative analysts, or “cowboy analysts” to some. They like their data raw, not aggregated. They ask questions, forage, synthesize, analyze, and publish.
In that same post Ted was introducing a new blog on the workgroup business intelligence scene, MakoMetrics written by Joe Mako, and focused on two tools; Lyza and Tableau.
Tableau is a powerful visualisation tool, and Lyza (although certainly doing some visualization too) provides data transformation functionality. I look forward to seeing Joe put them through their paces. As Joe points out in his blog:
I have struggled for years to turn raw data into useful information. The two primary challenges I face are preparing data to be analyzed, and actually analyzing it.
He goes on to say that he uses Lyza to prepare the data, and Tableau to analyze it.
Of course the datamartist tool is in exactly the same space as the data transformation capabilities of Lyza, so we look forward to increasing the scope of tool choices the creative analyst has when it comes time to dive into the data.
In 2010, Microsoft is expected to release the latest version of Excel with project Gemini which will increase what can be done on the desktop in Excel- clearly Microsoft is a believer in enabling workgroup BI, (and will be the Goliath to the Lyza and Datamartist Davids- bring it on.)
With new tools out, and coming out, there will be more choices than ever for those who know the value of getting down into the raw data.
Download Datamartist, and see our take on visual desktop data transformation.
« 6 Tips for making a business intelligence project budget | Datamartist V1.0.0 Released »


