« A new years resolution to data profile | Transposing data- columns to rows »
Datamartist V1.6 Released- Excel Dashboard enhancements
We are pleased to announce the release of Datamartist V1.6, and a powerful new capability for the generation of Excel based dashboards.
With the new version, Datamartist can insert data sets easily and visually into Excel workbooks as well as having the capability of defining a template, allowing automation of dashboard generation.
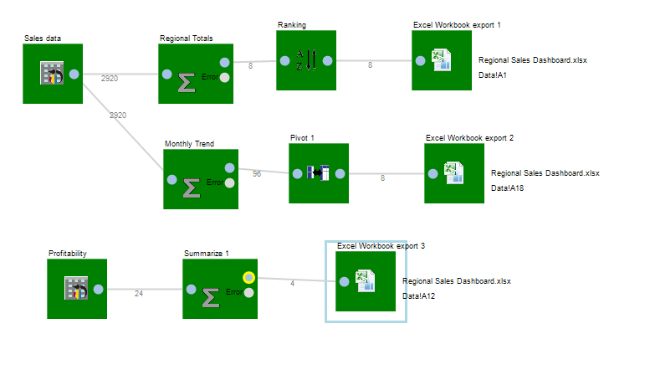
As always, data transformations are created visually, using blocks and connectors- in this case, we are analyzing some sales and profitability data.
We use blocks to summarize, transform and pivot our data, and then export it into specific areas of the desired excel template.

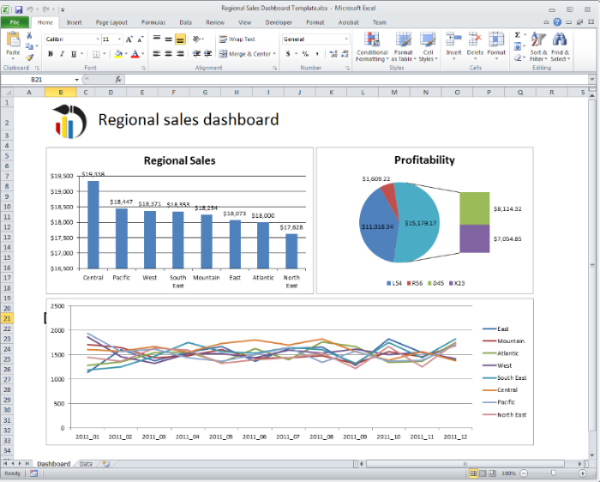
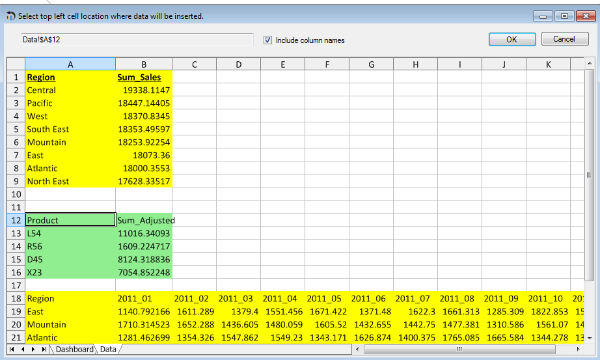
By inserting the data onto a “data” sheet in the template that has links to charts or tables on the dashboard sheet, we can create powerful, clear dashboards.
When in datamartist, you can see clearly where the data sets are going to be inserted- and datamartist generates the excel workbook(s) needed with all the data inserted. Because Datamartist can be run from the command line, you can automate your excel reporting, pulling data from databases and files, and generating professional looking dashboards that are easy to share and use.
The Excel export capability is far from the only enhancement that V1.6 brings. I’ll be blogging, and providing examples of new functionality in the coming weeks.
« A new years resolution to data profile | Transposing data- columns to rows »


