« Business Intelligence adoption low and falling | Build vs Buy the Allure of Out of the box business intelligence »
Data.gov: Looking at the US governments data
The Obama administration has taken another step in making government data available online in launching the Data.gov website. Whats on the site right now, and what can we do with it?
The website has two catalogs of information available- the “raw data catalog”, and the “tools” catalog. At the time of posting this, there are 47 entries in the raw data section, and 27 in the tools section. For this post, I focused on the “raw data catalog”.
Thinks I liked:
- The site lets users rate data sets- giving an Overall rating, and then rating on Data utility, Usefulness and Ease of Access (giving you a vote of 0 to 5 stars). Democratic. Thats keeping with core values.
- Each data set came with some extra info, including data dictionarys- for the example set it can be found here.
- The fact that the data WAS raw. Better to get it out there, then do something to it that makes it less useful.
- Although Catalog doesn’t yet have a lot of entries to need it yet, there is keyword search and filters by categories, government agency and file type.
- The US Federal government isn’t afraid to use the word “Potty” when it needs too.
POTTYAGE,Age of the most used toilet ,1,27,Numeric
POTTYLEAK,Does the most used toilet leak,1,28,Numeric
POTTYPARTS,Any of the part of the most used toilet replaced,1,29,Numeric
POTTYFIX,When was the most used toilet repaired,1,30,Numeric
Things I found disappointing:
- The data dictionary information was often in PDF format, when the contents were in fact a dimension table. Having this data in the form of a data file would save us some parsing. Here was the example pdf for the featured data set, for example.
- Related data sets were not grouped together- the catalog only had one data set per entry, even if some were directly related or joinable. It would be much more powerful to have the data sets grouped together. (This would also let us group together those dimension like tables if they were available.)
- Just not enough data yet, so I found the mish-mash of various data sets a bit bizarre. I didn’t have any pressing need to analyze Community collaborative Rain, Hail and Snow observations, or the Migratory Bird Flyways, or the detail of the world wide earthquakes in the past 7 days (although admittedly that last one is kind of cool).
Bottom line is any data is better than no data, and if there’s something there you’re interested in analyzing, then good on the US government to make it available for you. There is not a lot there now, but the hope is that over time more federal CIOs will feel the pressure to get their data available.
Whats going to be key, however, to make this all work is to establish a standard for both data and meta data that is more robust than throwing some csv files and PDF data dictionary documents on a web site. I look forward to seeing how this evolves.
Update: Sunlight labs, with sponsors including Google have a contest for the best analytical applications based on data.gov data.
Doing a deeper dive into the data with the Datamartist tool
I couldn’t resist taking a peak using Datamartist.
The featured data set that was displayed prominently on the Data.gov home page was the “Residential Energy Consumption Survey (RECS)” for 2005. The description of the data file is as follows:
The Residential Energy Consumption Survey (RECS), which is conducted every four years, provides national statistical survey data on the use of energy in residential housing units including physical housing unit types, appliances utilized, demographics, fuels, and other energy use information. This dataset (i.e., the full RECS dataset) is very large in size and may require specialized software to open on your computer. The file might not open completely in Excel 2003 or earlier versions.
The file ends up being very WIDE rather than tall- over 1000 columns, and 4382 rows, totaling about 10 Mb in a csv file.
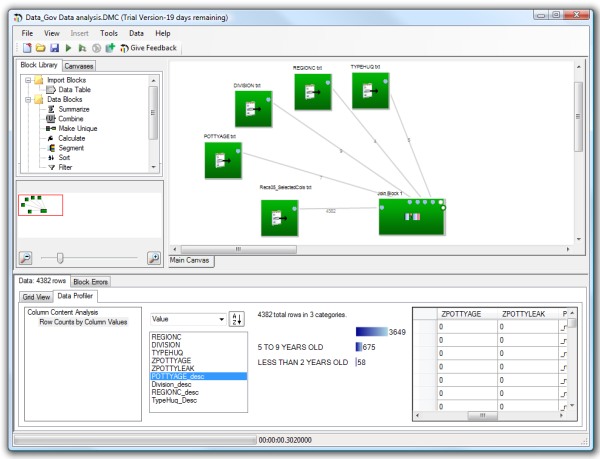
I did one pass to make a sub set file focusing in on a few columns, then I built some mini dimension tables to join up by cutting and pasting out of the PDF. Once I had the data in datamartist I connected up a join block and checked it out in the data profiler:

Oddly, when investigating POTTYAGE, I found that the majority of the rows had the value zero, which was not listed in the data dictionary. Hmmm. Perhaps even the feds have data quality problems now and again.
« Business Intelligence adoption low and falling | Build vs Buy the Allure of Out of the box business intelligence »


