« Automating data update for Tableau Server using Tabcmd and Datamartist | Exact isn’t everything- Surf your data! »
Data quality monitoring and reporting
In the vast majority of cases, useful data sets are not static, but are being updated, added to and purged constantly.
Data quality monitoring aims to provide data quality information that is also being constantly updated, and can be used to detect issues quickly, before the bad data piles up.
Don’t let those bad records pile up.
Imagine a company that does a mailing to its customers every 3 months. Imagine that a new call center training program is put in place, and unknown to all, customer information starts being incorrectly entered and updated due to an error in the program. When do you want to know about the growing number of invalid customer records? When its time to do the mailing, after 90 days of bad data generation, or after just a few days of problem entries?
ALERT! ALERT! Bad data Alert!
 The trick to data quality monitoring is having a set of data quality rules, and profiling tests that will automatically give indications of issues. Some rules are easier than others, but the idea is that each record or group of records in a the table(s) in question is checked against a series of tests, and the number of data quality rule infringements are tracked. As the size of the table grows, if the overall percentage of bad to good is increasing, you know you have an issue. If it spikes up, you sound the alarm.
Actually having a large fog horn wired up in the CEOs office is optional, due to the challenges of false positives (detecting a “Bad” record when in fact the record is ok).
I would also be very cautious in having automatic data modification processes going on, but setting alerts that will notify those responsible for potential data quality issues is a relatively straight forward exercise and will at the very least improve your visibility of data quality trends. What you do to deal with them is up to you, but at least some of the battle is being aware of the problem.
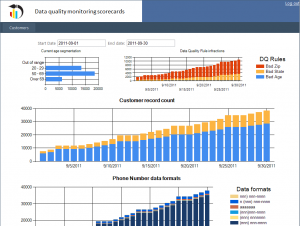
It monitors a number of things, but the key here is to make a decision for ever record if it is “Good” or “Bad”, and give some analysis of which data quality rules are broken. You can see in the upper right, there are row counts of infractions by a number of data quality rules. In the middle is the overall Bad vs Good split on the records.
The datamartist Pro version can quite easily create automated data quality monitoring. Using visual blocks, and arranging them on a Canvas, Datamartist lets you create data quality rules, define profiling on selected columns, and then automaticaly, as a scheduled process, place the results either in Excel reports/dashboards or into a database for use by your reporting tool of choice.
By understanding how your data quality evolves, and catching problems early, you can reduce the amount of cleansing you need to do, and communicate clearly and regularly to your organisation the progress your data quality programs are making.
« Automating data update for Tableau Server using Tabcmd and Datamartist | Exact isn’t everything- Surf your data! »


