« Inner and outer joins SQL examples and the Join block | Datamartist V1.2 now available »
Tableau Public- great visualization now where do we get the data?
 Good news on the visualization front this week when Tableau announced that it was making its well received visualization software available in a free public version, as well as providing a structure to allow users to integrate Tableau visualizations into their websites.
Tableau has received a fair amount of positive response from the visualization world. Even Stephen Few, who isn’t shy to point out when visualizations are straying from the straight and narrow has been supportive of Tableau from the start.
We’re excited about this new access to such a great data visualization tool because we know that people who do visualization have to transform their data- and if users of Tableau want a flexible, visual data transformation tool, the Datamartist tool is an obvious choice.
Free Tableau vs Professional version

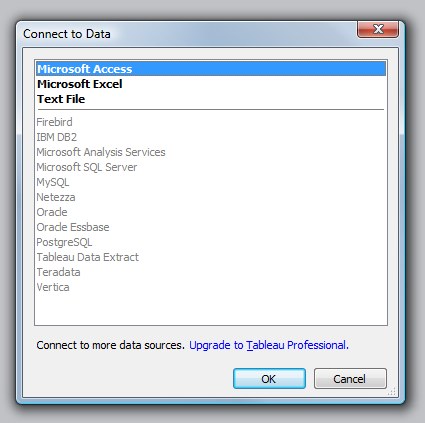
There are of course some limitations with the free version of Tableau, in comparison with the full featured professional version ($1600 USD per seat.)
- Data import capabilities – Only MS Access, Excel and Text files
- 100 000 row Limit per table
- 50 Mb Limit per organization for the web server.
None of these limitations will stop you from making some pretty fantastic visualizations as long as your final summarized data set fits within the limits and you put it in the right format. But it does mean that to use this version of Tableau, you need to use another tool to get those large data sets summarized. This is probably something you are doing anyway, because there is almost always some data cleanup to do.
Get your data sets ready- there are going to be some beautiful viz getting made
The trick with visualization of course, is that you need data to visualize. With tools like Tableau, as good as they are at making the pictures, you have to get the data set to them first- and we all know how many pre-formatted, all is well, no data quality issues data sets there are lying around the real world (Hint: none.).
But I’ll tell you, once you do have the data, what a fantastic bit of interactive web based visualization Tableau can do.
Often, people use a combination of MS Excel and Access to create the datasets that they want, then connect to the Access database with Tableau. Of course, we suggest you try Datamartist instead. Datamartist and Tableau are a powerful combination- first, using Datamartist pull data from mutliple sources (Datamartist loads out of SQL Server, Oracle, MySQL, and at a license price much less than Tableau Professional).
Datamartist lets you join tables visually (using a venn diagram interface that we’re proud of), segment data using rule sets, summarize millions of rows if needed, and generally parse and transform with an easy to use calculation engine. Once you have the data where you want it, export it easily to an Access database, and let Tableau Public generate the visualizations that you need.
I’m excited about Tableau’s decision to make its power available in this public version. I intend to do some serious data crunching with the Datamartist Tool, followed by some interactive visualizations with Tableau Public. The beauty of the Tableau Public setup is that I can then publish the visualizations right here in the blog, and highlight what the combination of these two tools can do.
« Inner and outer joins SQL examples and the Join block | Datamartist V1.2 now available »


